Customer Experience Analytics for Every Step of the Customer Journey
By Kathryn Casna
Numbers don’t tell you everything. How much a customer paid for your product won’t tell you the value they get from it. The number of positive reviews you get on Yelp doesn’t tell you how hard your service agents work to earn them. And your bottom line generally glosses over the value of your company and its incredible growth potential.
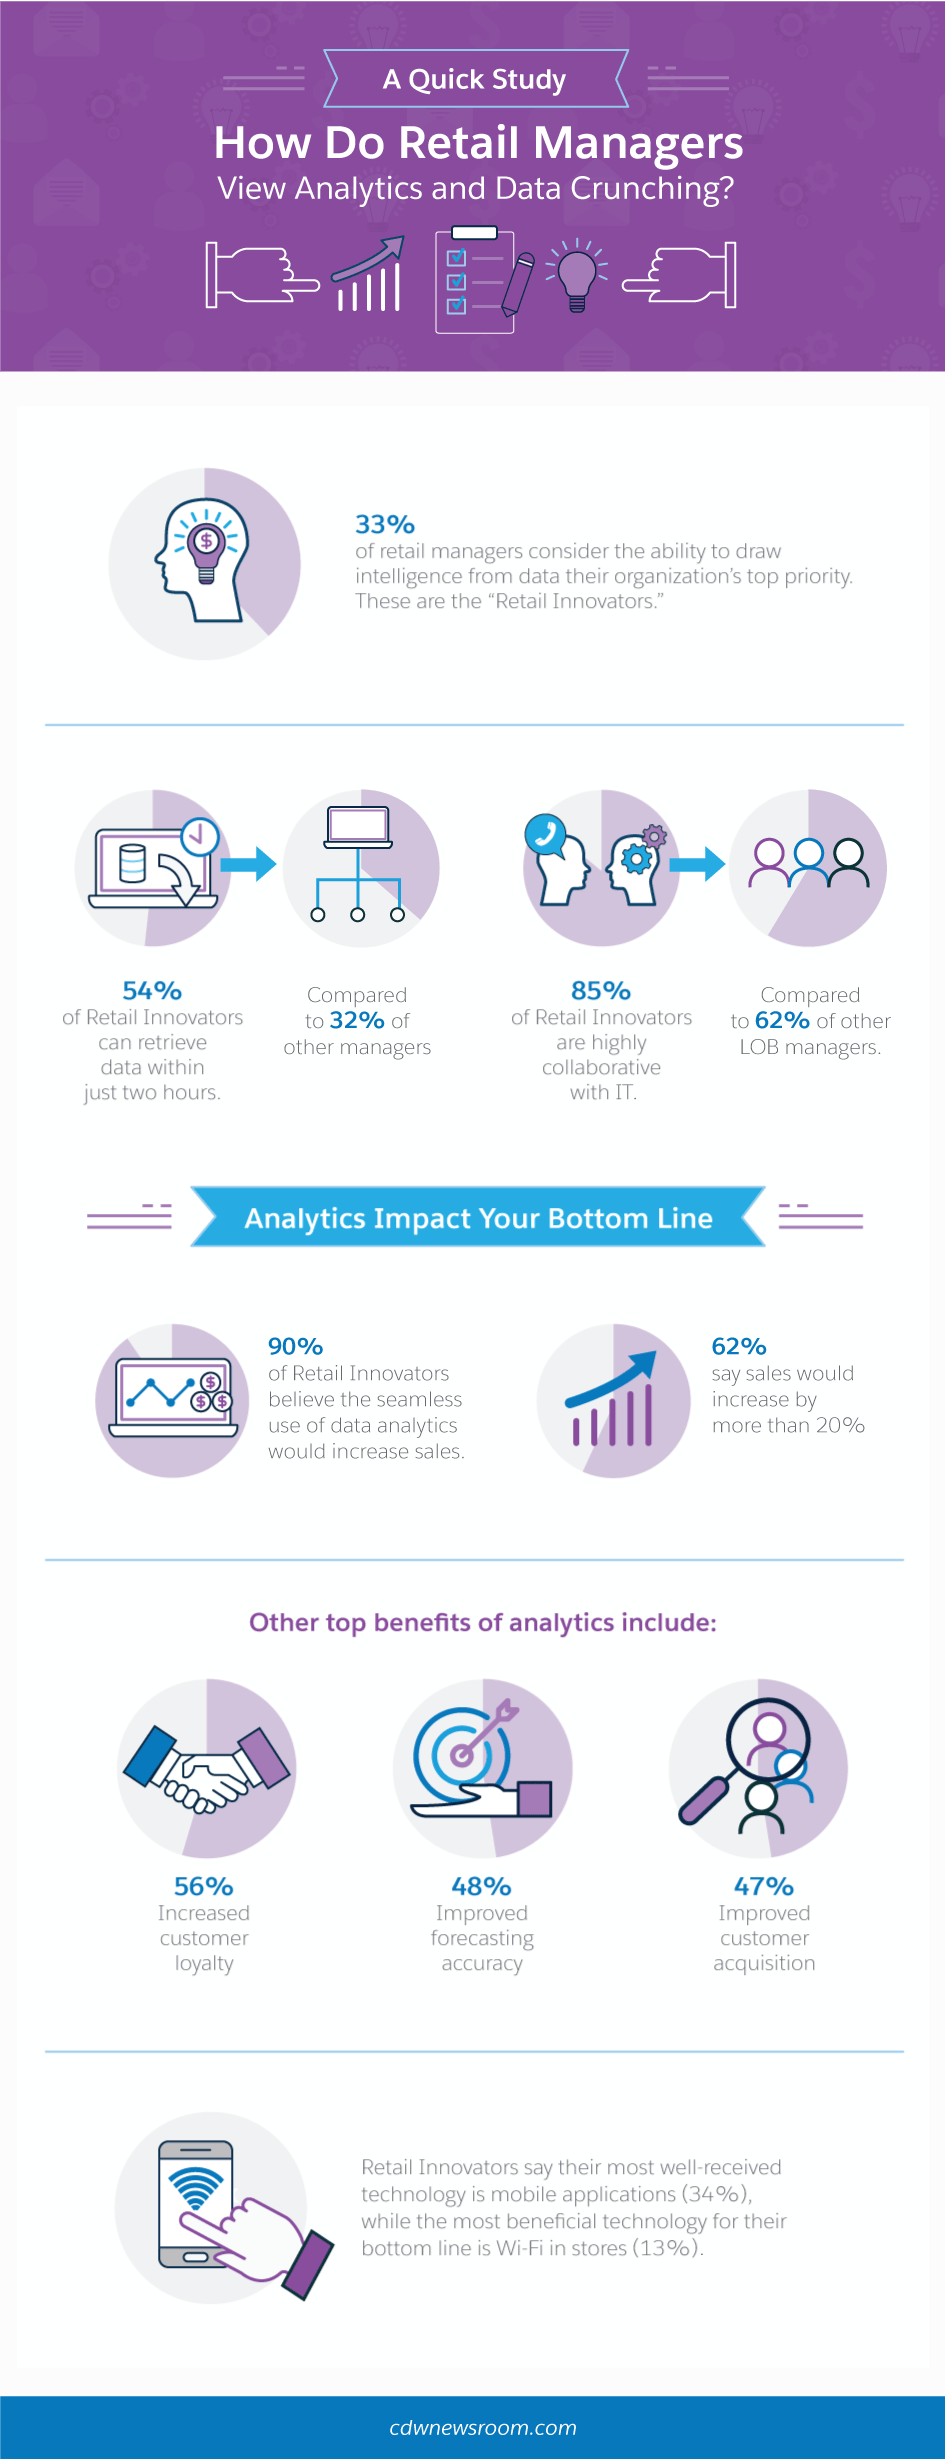
While numbers don’t reveal everything about a company, they do have their uses, even when it comes to measuring something so personal and individual as the customer experience. In fact, analysing the numbers associated with customer journeys are critical to your success as a company. Just ask the 90 percent of retail innovators who believe that having seamless data analytics would increase sales, or those who say customer experience analytics increased their customer loyalty by 56 percent.
Businesses that see their customers as mere accounts and metrics will likely struggle to provide a great customer experience. But that doesn’t mean collecting and analysing the numbers on your customers can’t help you nail great customer interactions. It’s all about prioritising the right numbers — those that genuinely reflect service quality — while framing what they tell you in a comprehensive customer journey.
The Customer Journey
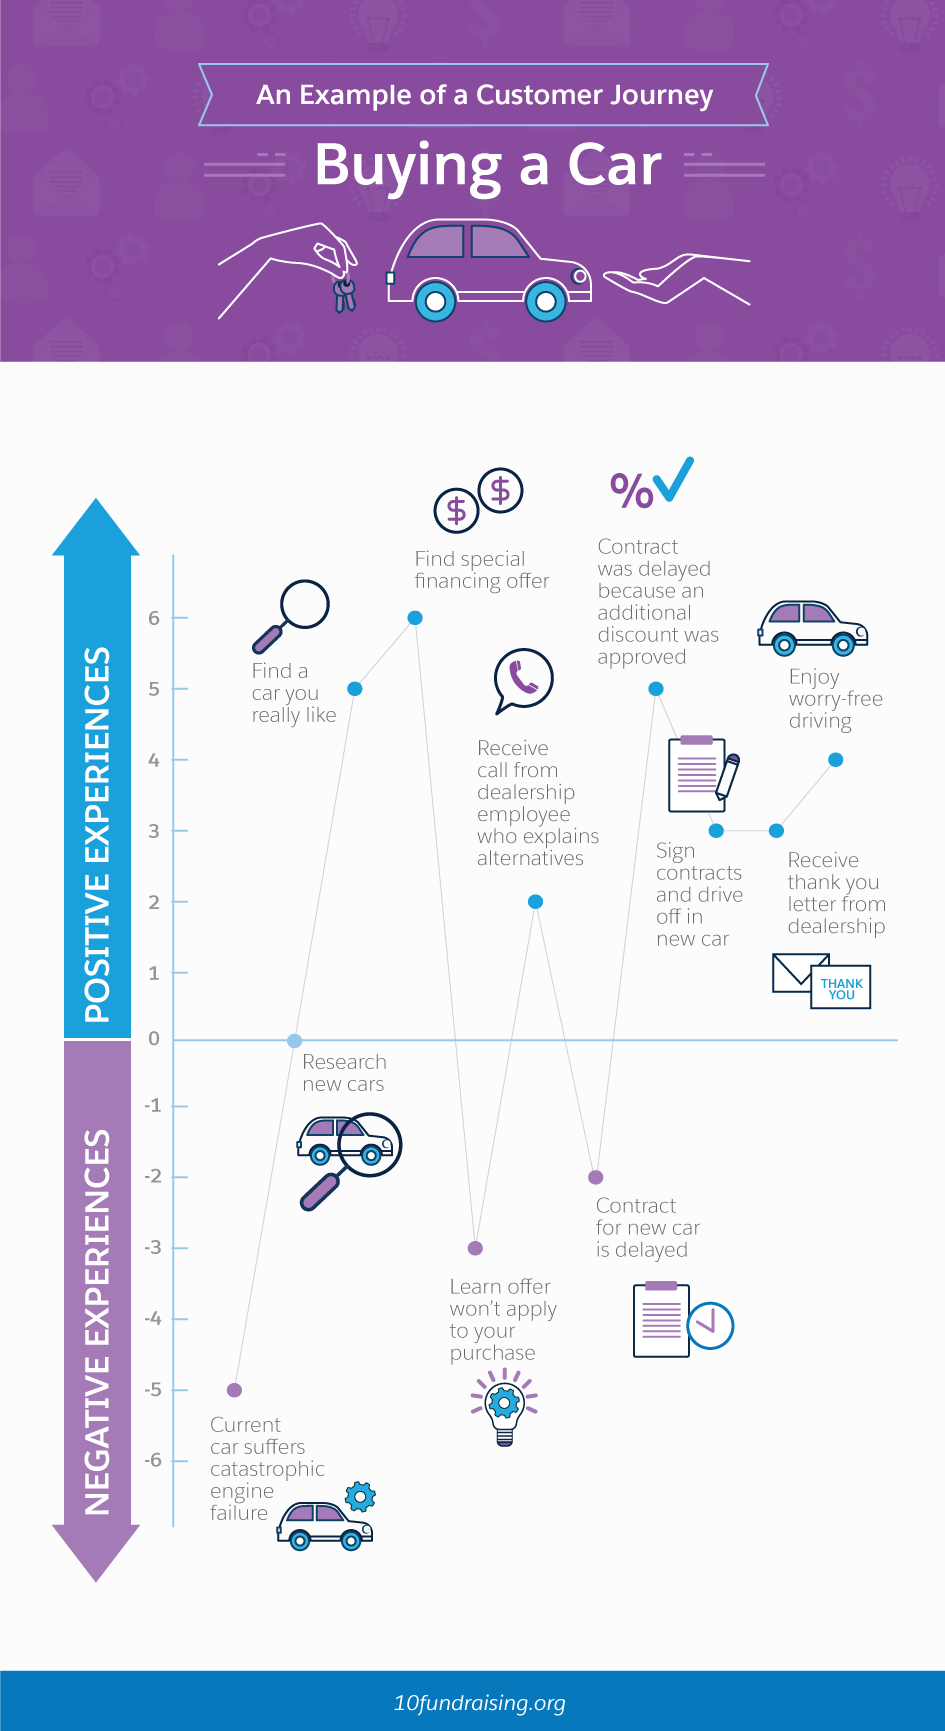
The journey may begin with a prospect having a need, or perhaps a prospect will see an ad for what you offer and then realise their need. Their journey will continue through researching the company and its products, and they’ll make their way through the sales funnel until their first purchase. The journey includes all touchpoints with customer service, sales, and marketing, as well as interactions with fellow customers on social media and review sites. It will also include any additional purchases the customer makes, or if they “break up” with your company — if it comes to that.
If it seems like measuring everything along the customer journey is impossible, you’re partially right. Customer journeys are highly personal for each individual, and getting inside every customer’s head at every single touchpoint is a feat some business leaders would pay a small fortune for. But that doesn’t mean collecting and analysing as much data as you can won’t help. In fact, 82 percent of B2B and 89 percent of B2C marketing leaders say analytics are critical to creating a cohesive customer journey.
What to Track
Early Stage
The beginning of the customer journey consists of a prospect becoming aware of their need for a product or service, as well as learning about your industry and brand. Awareness of your brand may come before a customer recognises their own need, or during the research process for fulfilling that need.
During this process, a customer may interact with your brand in many ways, including on or through:
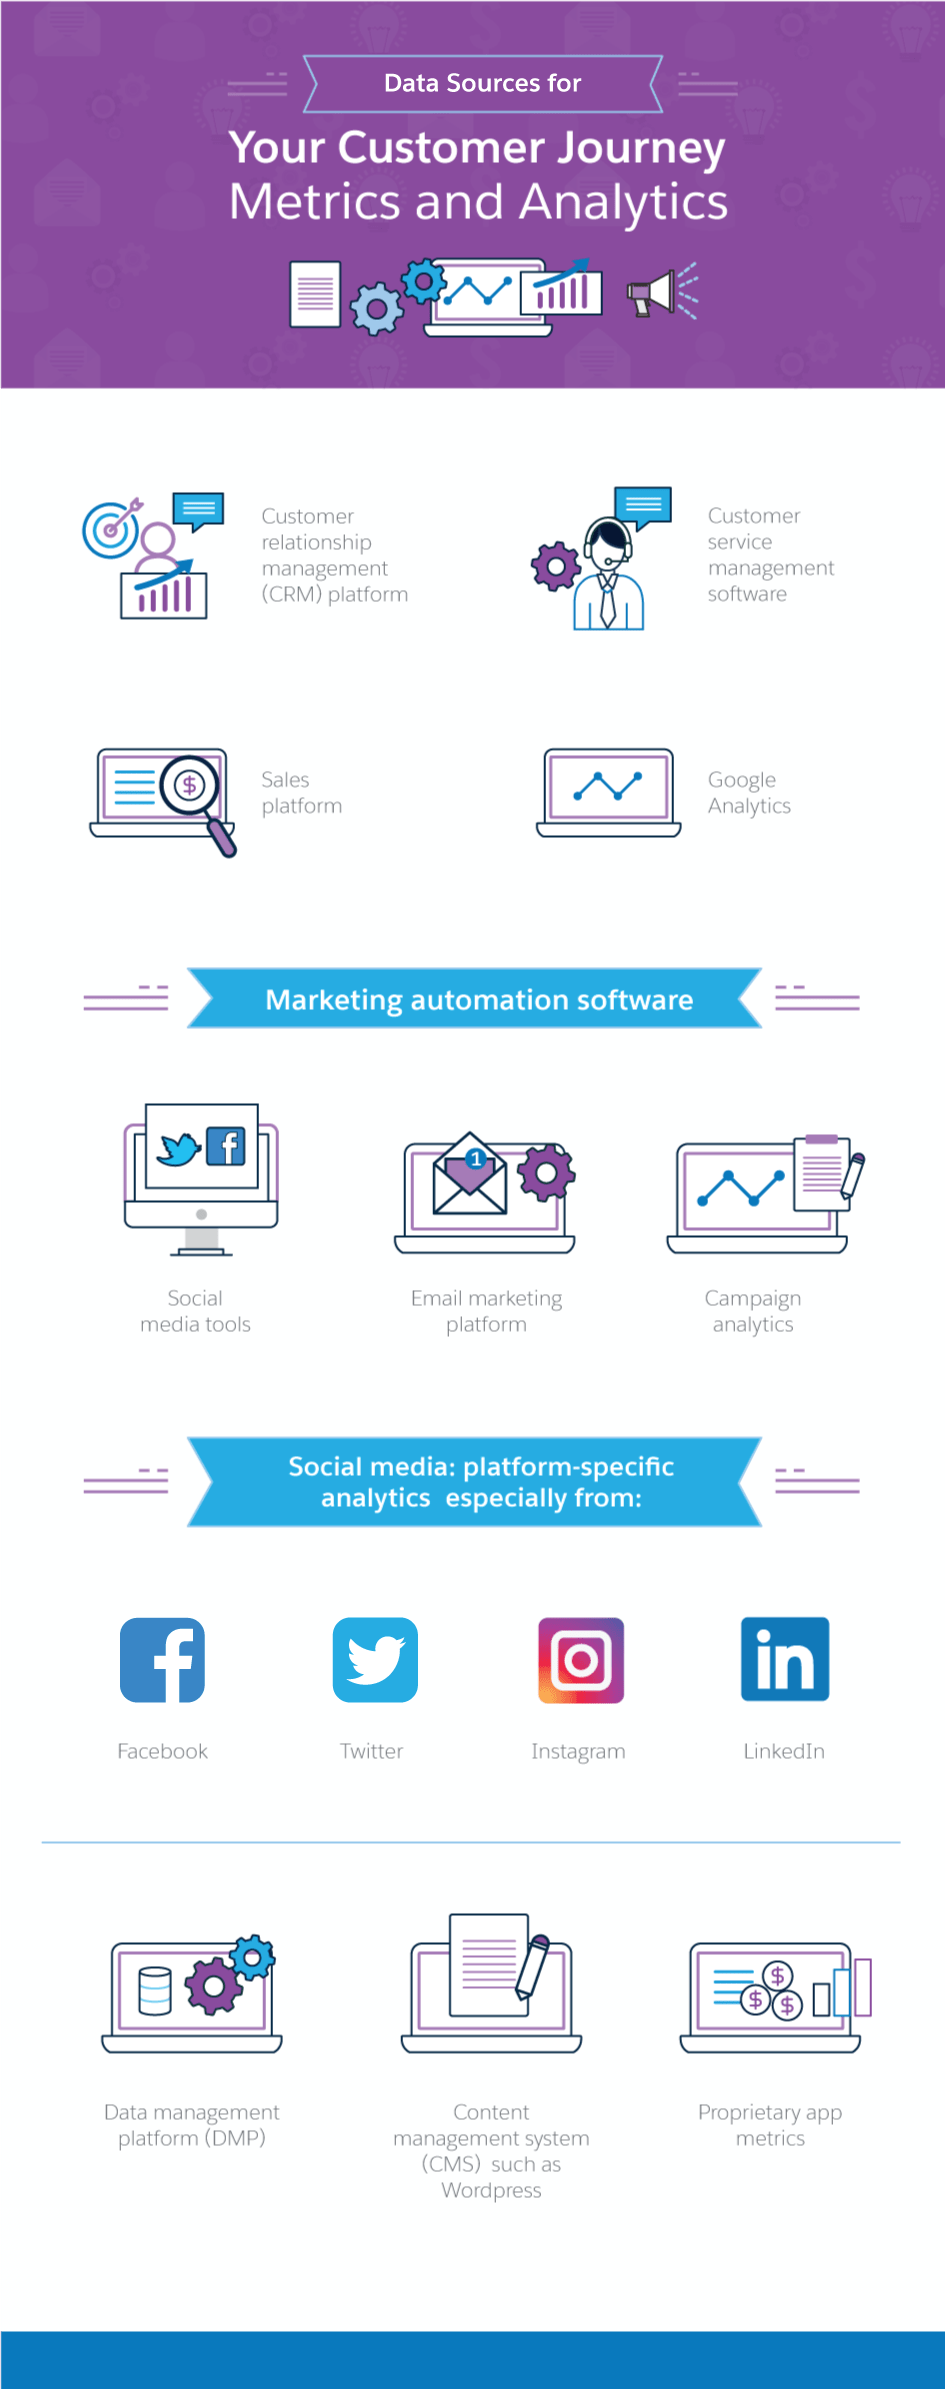
Social media, such as Facebook and LinkedIn
Google ads
Review sites, such as Yelp and Angie’s List
Word of mouth from trusted friends and family
Other ads, such as television, commercials, store signage, and newspaper ads
The beginning of the customer journey can be challenging to track because sometimes your customers don’t remember when or where they first heard about you. It can also be challenging to track individual data from singular customers from start to finish along their journey. There are ways to harvest data from this stage of the customer journey.
Social Listening. Businesses can keep an eye on what specific followers are saying manually, but social listening tools equipped with AI work best for sorting through comments, likes, shares, and sentiment, as well as tracking an individual’s interaction with your brand on social networks.
How Did You Hear About Us? This simple question, posed to customers who come into your store, call, or visit your site, can help fill in the blanks when digital tracking simply isn’t possible. A variation on this technique is offering a discount when customers give the “secret password” or “mention this ad.” Vary the code for each marketing channel, and you’ll know how to gauge their effectiveness in bringing in customers.
Opens, Views, Clicks, and Traffic. These are all measurements of steps in the digital customer experience, and are therefore easier to track. Open rate refers to how many prospects open your emails, views are the number of users who saw your post or ad, and click-through rate (CTR) refers to how many users actually click a link and follow through to your website from any number of sources.
Tracking the source of your traffic is also critical. Many businesses use Google Analytics, A/B testing, or the analytics that come from Facebook or Google ads to gain insights about how effective specific strategies are. Then they refine touchpoints accordingly.
Middle Stage
Bounce Rate and Pages per Session. Once a customer lands on your website, they may be ready to enter the purchasing stage of their journey, or they may still be doing research. Perhaps they arrived there by mistake (which may be indicated by the metrics time on page or bounce rate), or don’t find what they’re looking for. Bounce rate is the number of users who leave after viewing just one page, and pages per session measures the number of pages a visitor views before leaving. These metrics can tell you how well users interact with your brand on your site. The more pages viewed, the more the interaction.
Visits. This refers to the number of times a single user visits your site. Theoretically, the more times a prospect visits, the more likely they are to buy.
Session Recording. Many companies invest in software that records video of users interacting with their website. This helps management see what might cause high bounce rates, low pages per session counts, and a lack of return visits.
Conversions. This is the number of prospects who actually make a purchase or perform the action your landing page guided them to do. Digitally, this could mean the number who complete a purchase via your ecommerce site, but the number should ideally also include those who come into your store to buy or who complete a transaction over the phone.
Time to Launch. This is helpful KPI. It measures how long it takes a prospect to convert.
Checkout Abandonment Rate. Cart abandonment can alert you to problems with the customer experience on your ecommerce site, as well as other issues that prevent leads from pulling the trigger. These may include pricing surprises or lack of trust in the website’s security.
Late Stage
Support Rate. What is the percentage of customers who require customer support? Dive deeper and look at trends in the types of support requests or reasons for needing support. You need to learn if you can improve your product, delivery, customer service, website, or other aspects in order to reduce these requests as much as possible.
Net Promoter Score. Also called NPS, this metric answers the question of how likely a customer is to recommend your brand to someone else. The options range from enthusiastic promoters to lackluster passive customers, to unhappy detractors.
Upsell/Cross-Sell Rate. This percentage shows you how many customers upgrade or continue to make purchases. This metric can help you learn how much trust and satisfaction customers have with your company.
The Big Picture
Personalise
What makes for the most effective customer journeys? Personalisation. Customer experience analytics solutions that include automation and artificial intelligence help businesses use all the data they’ve captured to make each customer’s journey unique.
Optimisation
The immediate and perhaps most obvious use for analytics is to feed insights back into the customer journey itself. A/B testing is particularly helpful for this, but bounce rate, cart abandonment, and support rate can provide insights as well.
Integration
Only 17 percent of business leaders say they’ve fully integrated customer data across their entire organisation. Meanwhile, nearly all (97 percent) of those who have fully integrated this data in their companies say it helped them create a cohesive customer journey across all touchpoints and channels.
Great customer journeys are hard to deliver because they require collaboration across entire companies. Every person and system, from product development to packaging, accounting, and shipping, not to mention the more obvious marketing, sales, and customer service departments, affects the customer journey.
Organisations tend to organise themselves into silos, which are independent (or even competitive) branches within a company. Traditional marketing departments, for example, developed product-based teams that would compete for resources and attention for their own products. To overcome that particular type of silo, leaders can separate teams by touchpoint or “location” in the customer journey. Consider making structural or cultural changes to get the most out of your customer service analytics and improve your customer experience. Your company will only benefit from your efforts.


Uncover new trends and insights to make smarter decisions.
