College and university leaders, especially senior enrollment management officers, are challenged with complex issues when trying to strategically drive institutional health and student success.
Shifting demographics, the need for increased net revenues, online learning options, declining transfer markets, and many other pressures demand a long-term vision for enrollment, rather than endless short-term, tactical approaches. Where can institutional leaders begin to unpack these complexities and develop a plan that has the strongest potential to help the institution realize its strategic plan and vision for success? Key Enrollment Indicators (KEI) are a good place to start.
KEI are a set of factors that help an institution understand its complex enrollment patterns in the context of its unique culture and enrollment profile. They are divided into two groups, enrollment cohorts and metrics of success. Understanding the KEI of the institution will help its leaders, faculty, administration, and staff make better choices about where enrollment initiatives (strategies and tactics) will have the greatest impact on the institution’s health and student success, constantly moving toward what Michael Dolence called its “optimum enrollment” in the context of the academic mission.
Here are five steps to optimizing student enrollment by defining your own institution’s KEI.
1. Defining enrollment cohorts
Enrollment cohorts are the broad audiences or student types that are currently enrolled at an institution, or new ones that an institution may seek to enroll. There is no one-size-fits-all enrollment cohort set that can be applied to all institutional types. There are colleges located near military bases where “military” is a distinct cohort. Four-year institutions with very small international enrollments may not need to segment this group apart from freshmen.
When a student type tends to behave much like another in initial and ongoing enrollment patterns, they should be combined. Discrete segmentation can occur later when tactics are applied. As a general rule, the fewest number of cohorts is best — not the most number of cohorts. Having too many cohorts leads to diffuse strategies and too many irons in the fire at one time.
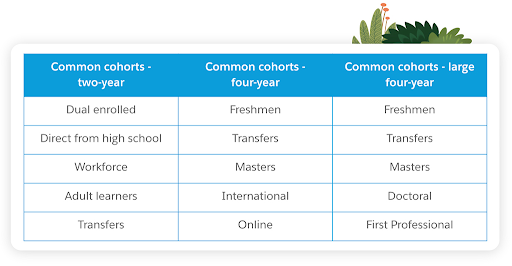
An example of common enrollment cohorts for two- and four-year institutions.
2. Collect student lifecycle data
Once the enrollment cohorts have been identified, the next step is to collect data across the student lifecycle for each cohort you identified. For example, what was the pre-enrollment “funnel” for dual enrollment, direct from high school, transfers, workforce, and adult learners at a two-year institution? What was the persistence rate for each cohort, once they started on a degree/credential pathway?
Collecting five years worth of data will help identify any anomalies that may come from just a single year’s data. This is often a point in the process where institutions may not have all their data in one system or even capture the needed data to complete each stage of the lifecycle. The best possible data should be used, but it’s not uncommon to use this exercise as a way to identify data and system gaps and note them as needed for future improvements.
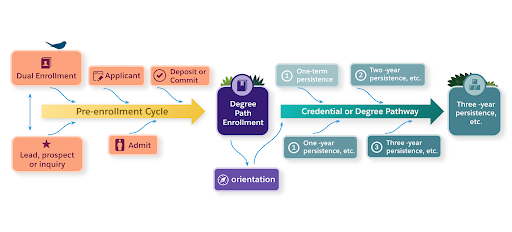
An example of a student enrollment lifecycle for a two-year or a four-year college or university.
3. Define metrics of success
These data points start to form our second KEI group, metrics of success. Some of these metrics are simply counts, such as the number of inquiries or applications, the number of new students, or graduates. Others are the conversion rates between each stage of the student lifecycle. The next table lists common metrics that may be used in creating an institution’s KEI.
Like the enrollment cohorts, these are subject to the unique nature of enrollment at each institution. The last column of these KEI is a level beyond merely tracking the flow of students across the lifecycle. These are sometimes referred to as “momentum” indicators, as they track patterns associated with students being on or or off track to complete a term, year, credential, or degree.
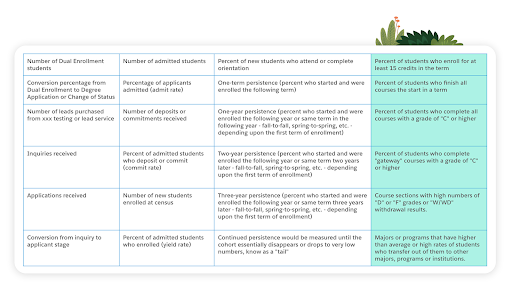
An example of some common key enrollment indicator metrics of success that are term and enrollment cohort-specific.
4. Develop an enrollment model
Using a simple set of cohorts, the next table displays the way these could come together to form an enrollment model. For this example, just three cohorts are used — freshmen, transfers, and graduate students. The dark purple column near the center shows the actual number of new students for each cohort.
The columns to the right calculate the number of pre-enrollment cycle students required at each stage of the “funnel,” based upon historical conversion data for that cohort. The columns to the right show the persistence rates for that cohort, which are also based upon historical patterns.
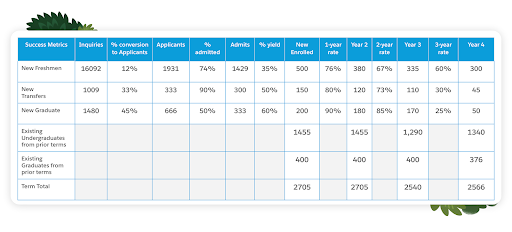
An example of a simple enrollment model using KEI.
The above table is the starting point. It allows an institution to see that if it doesn’t change its KEI, it can’t change its overall enrollment outcomes. This begins the discussion about which KEI would help the institution meet its overall target for enrollment over time. Why do 40% of freshmen leave before completing a degree? What barriers exist and what control can the institution exert to remove them?
The value of the model is that it allows various stakeholders to discuss their perspectives on what would be the best path to move the institution forward in its enrollment and to foster student success.
5. Use the base model to iterate and optimize
The starting point model can be copied and many versions of it created until the institution feels it has arrived at the best mix of its student cohort numbers, improvements in student outcomes, and the overall target for enrollment that aligns with its mission, vision, and culture. This takes time and there are typically divergent perspectives on where and how to grow enrollment.
The strength of the academy lies in its debate and that has to be respected and leveraged to allow this “best fit” combination of KEI to emerge. The discussions are naturally iterative and lead into conversations of strategy (“how would we do this?”) and the role of leadership or an external facilitator is to keep it coming back to the higher level of optimum enrollment mix.
The table below shows a potential best fit model that is the result of stakeholder discussions and leadership endorsement. It has a combination of challenges to increase new student levels across all three enrollment cohorts, as well as improvements in persistence in each. By doing this, the strategic enrollment management (SEM) plan goals become clearer: increase each cohort from its starting point level to this outcome within the next x number of years.
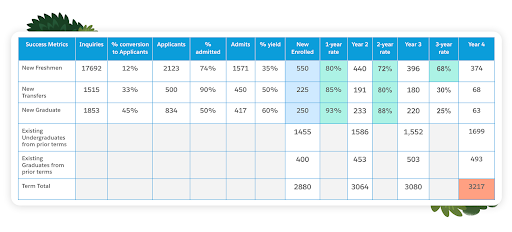
An example of the best fit model to meet enrollment outcomes and student success.
The model must also be used to examine strategies in the pre-enrollment funnel. How could recruiting and/or lead generation be more cost effective if the conversion rate from inquiry/lead/prospect to applicant was increased? How can the admissions office connect admitted students to faculty in their majors to increase yield? What new methods, sources and partnerships will be needed to reach adult learners who can add to transfer and graduate numbers?
Key takeaways for implementing KEI at your institution
There is much more to the SEM journey. A strong SEM planning effort includes gaining support at the executive level early and creating representative and cross-functional planning teams, methods for developing and focusing goals, strategies, and tactics.
KEI help an institution frame their enrollment issues by defining enrollment cohorts and metrics of success, then placing those into a model. The goal is to drive discussion; it’s not a way to precisely forecast enrollment. There will be a margin of error with any model and, over time and use, modeling improves. Institutions shouldn’t embark on KEI work with the expectation that this is a crystal ball.
Allow time for institutional stakeholders to absorb the concepts and data being shared with them. Too often, the process is rushed and, as a result, a single person or office winds up creating a report that isn’t “owned” by others who will be asked to implement its success. This is especially true for chief enrollment management officers, who live with the data every day and are under pressure to produce enrollment results. It’s important to allow time for questions, debate, and reflection.
The KEI process inevitably identifies gaps in data. There will be things you wish you could track, and you’ll find gaps where students disengage or depart and you don’t have information to explain it. Embed these gaps into the plan as strategies or tactics for collecting better information as you move forward. Seek data that proves or disproves the current narrative about why students leave or why they aren’t successful. Use these gaps to help improve student support and to help the institution shift its culture to being student-ready, and away from the narrative that students aren’t college-ready.
Team Earth has landed
We believe that business is the greatest platform for change, and success should be for everyone on Earth and the planet itself. Because the new frontier? It’s right here.


