The data is always talking. It’s our job to listen. With the pandemic impacting countless industries, the story data tells keeps shifting. Is your sales pipeline generating enough leads? Tracking can help you figure out why. Are deals remaining open for too long? The numbers will tell you if it’s time to run a promotion. To keep afloat in these times, sales leaders need to have access to reliable data, and these sales management dashboards can help.
Data dashboards, standard with Sales Cloud, provide minute-to-minute visibility of your business as things change. They allow you to identify actions to take before it’s too late. Below are seven examples of Salesforce dashboards you can reference to help you hit or exceed your revenue targets.
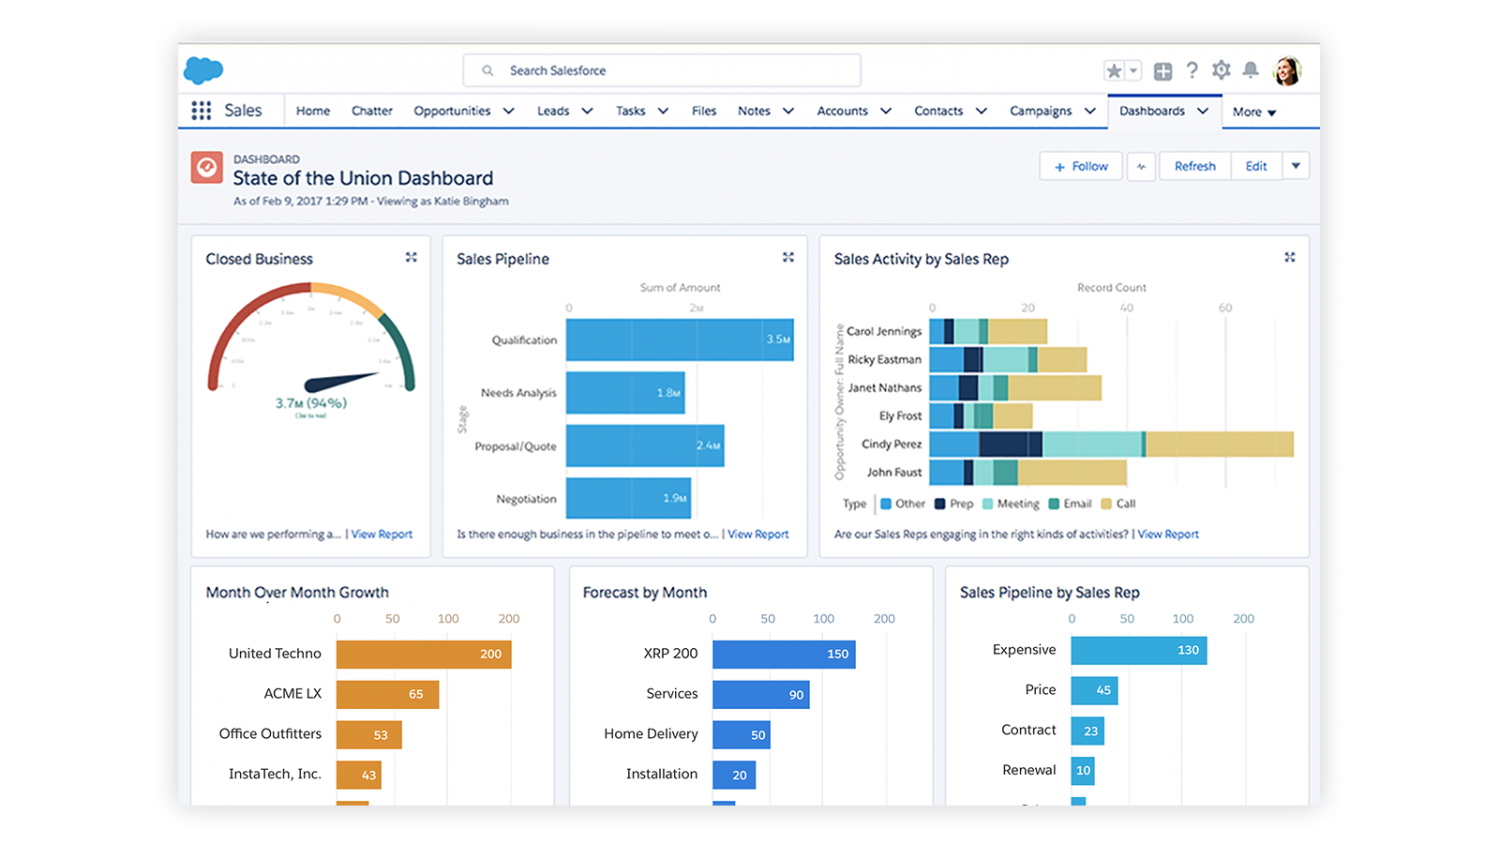
1. Use ‘State of the Union’ for a bird’s eye view of your company’s performance
What this dashboard answers: How is the business doing?
Who it’s for: Sales executives
When to use it: Every day!
How it works: Think of the State of the Union dashboard as akin to getting a general check up at the doctor’s office. You can immediately get a pulse on the overall performance of your organization. Key performance indicators like total closes, open pipelines, sales rep performance, and top deals are available in real time. Don’t waste hours aggregating data manually or creating decks when this dashboard does the dirty work for you. That’s valuable time you can put into coaching or training.
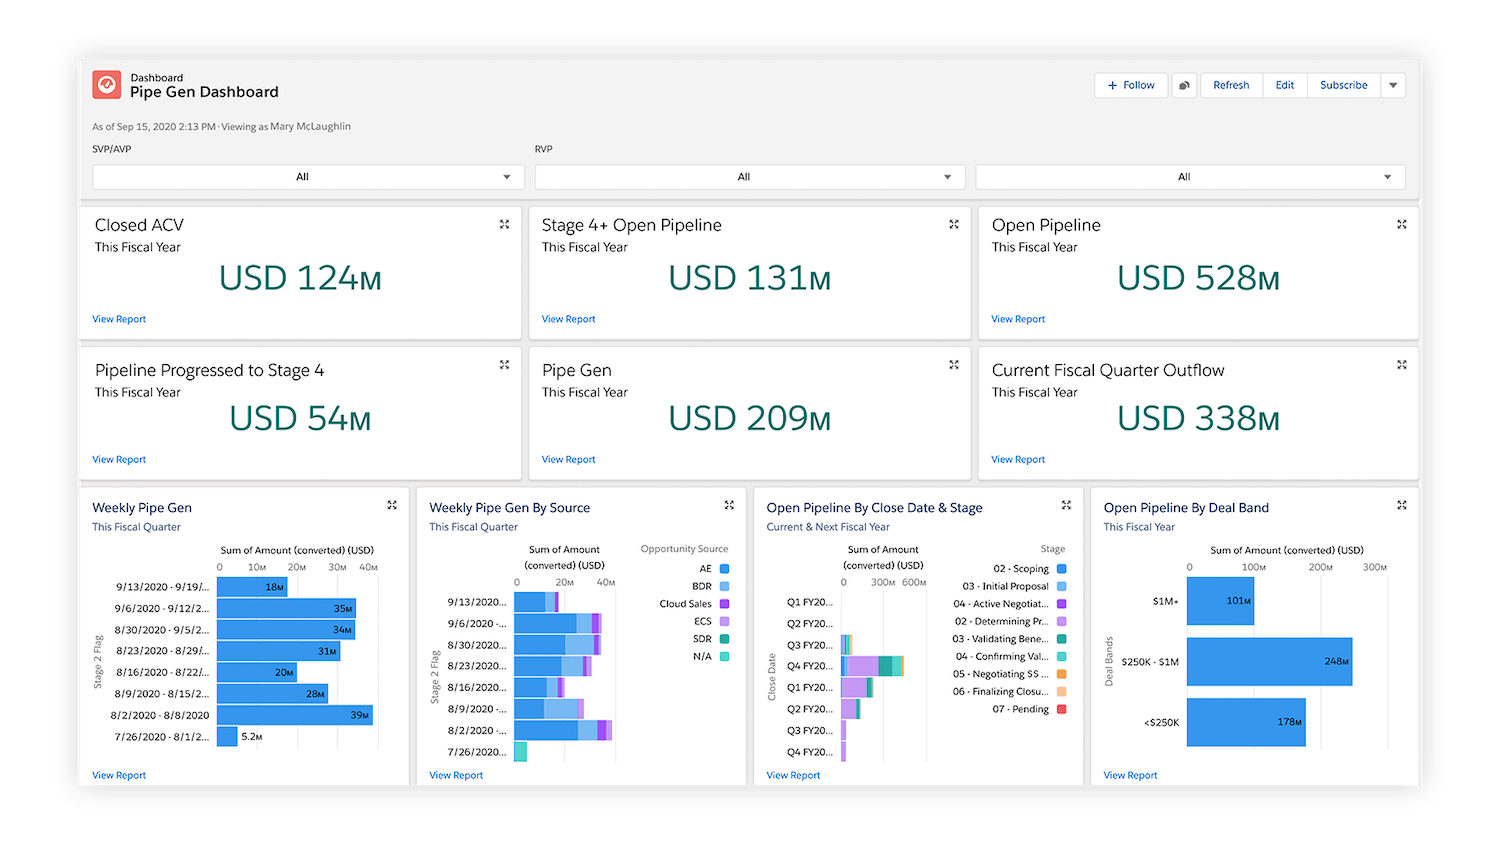
2. Spot trouble early with ‘Pipe Gen’
What this dashboard answers: Do I have enough pipeline?
Who it’s for: Sales managers, marketing, all reps
When to use it: Weekly or biweekly, depending on your targets
How it works: Pipe Gen is all about catching small problems before they become big problems. If State of the Union is a bird’s eye view of where your company is, then think of Pipe Gen as a worm’s eye view. These sales management dashboards drill down into growth metrics and lets you keep close attention on progress. Say you need $10 million worth of pipeline in order to hit $2 million in revenue. The Pipe Gen dashboard lets you know if you have enough to reach that target.
You can also use this dashboard to quickly spot an underperforming pipeline at the beginning of the sales cycle. Is a pipeline bad because your team isn’t pushing hard enough or because that region is experiencing an economic downturn? Do you need to bust out a promotional campaign? Pipe Gen will help you determine your best option. It helps you to be proactive instead of reactive.
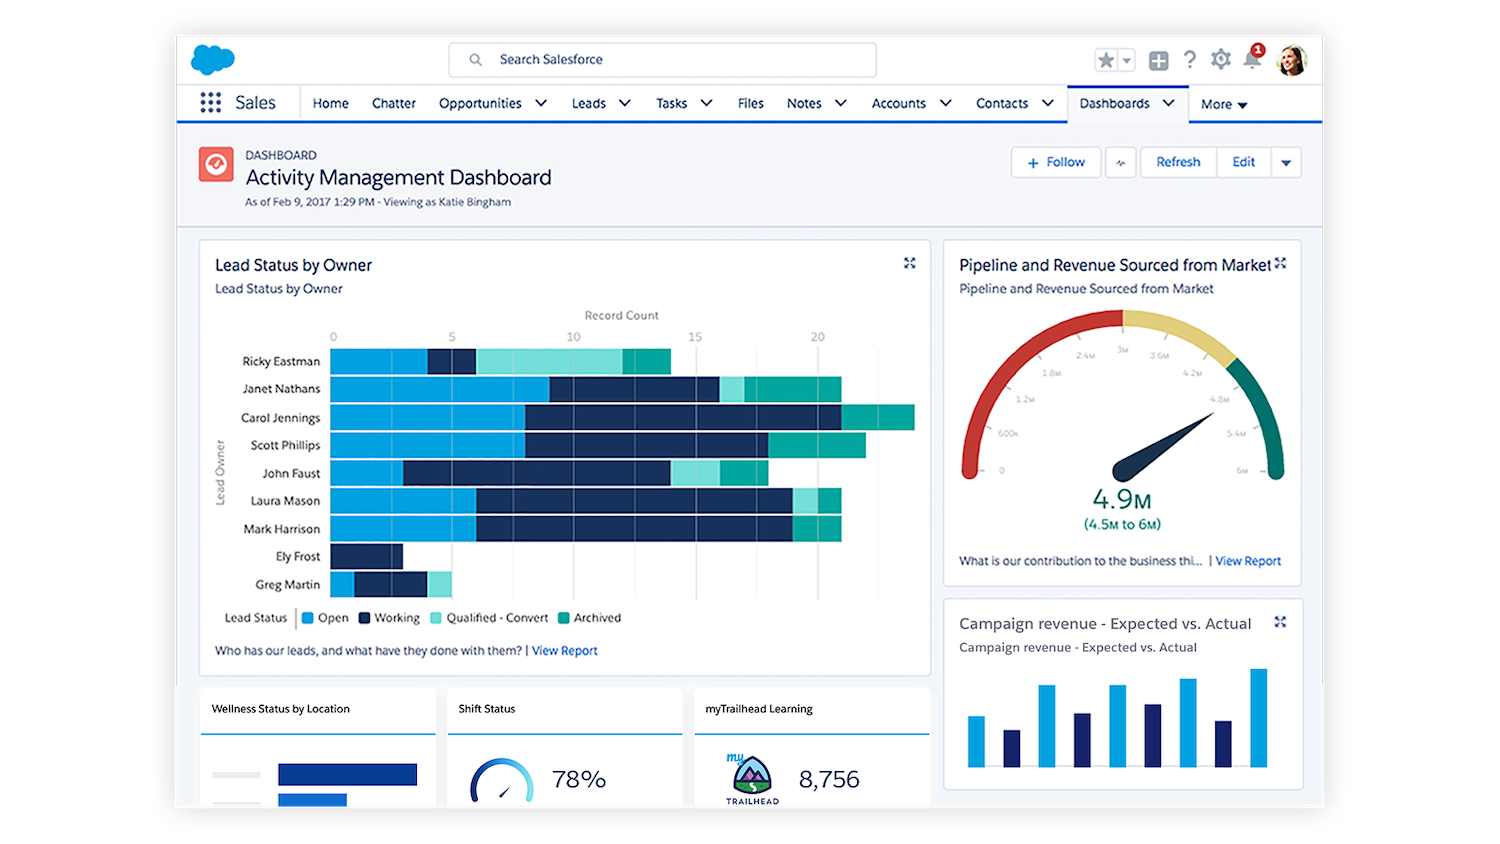
3. Rely on ‘AMP’ to manage your account executives’ most precious resource: Time
What this dashboard answers: Are my account executives using their energy wisely?
Who it’s for: Account executives, all reps
When to use it: Weekly or biweekly
How it works: With teams working remotely, accountability can get tricky! The AMP dashboard (which stands for Activities, Meetings, and Pipeline) helps you identify where your sales team could better spend their time and resources. Face-to-face meetings, which in this era have turned into Zooms and Google Hangouts, are the most important precursor to a strong pipeline. Here you can measure how many overall interpersonal interactions it takes to close a deal. How many calls did a rep make each day? How many emails, video chats, text messages, LinkedIn messages? It gives you raw data about how your account executives spend their time.
If your Pipe Gen is showing poor results, one of the first places to check is AMP to see if there’s a talent issue. Are your reps landing enough meetings? Keep your reps engaged with these sales management dashboards to boost healthy competition and motivation.
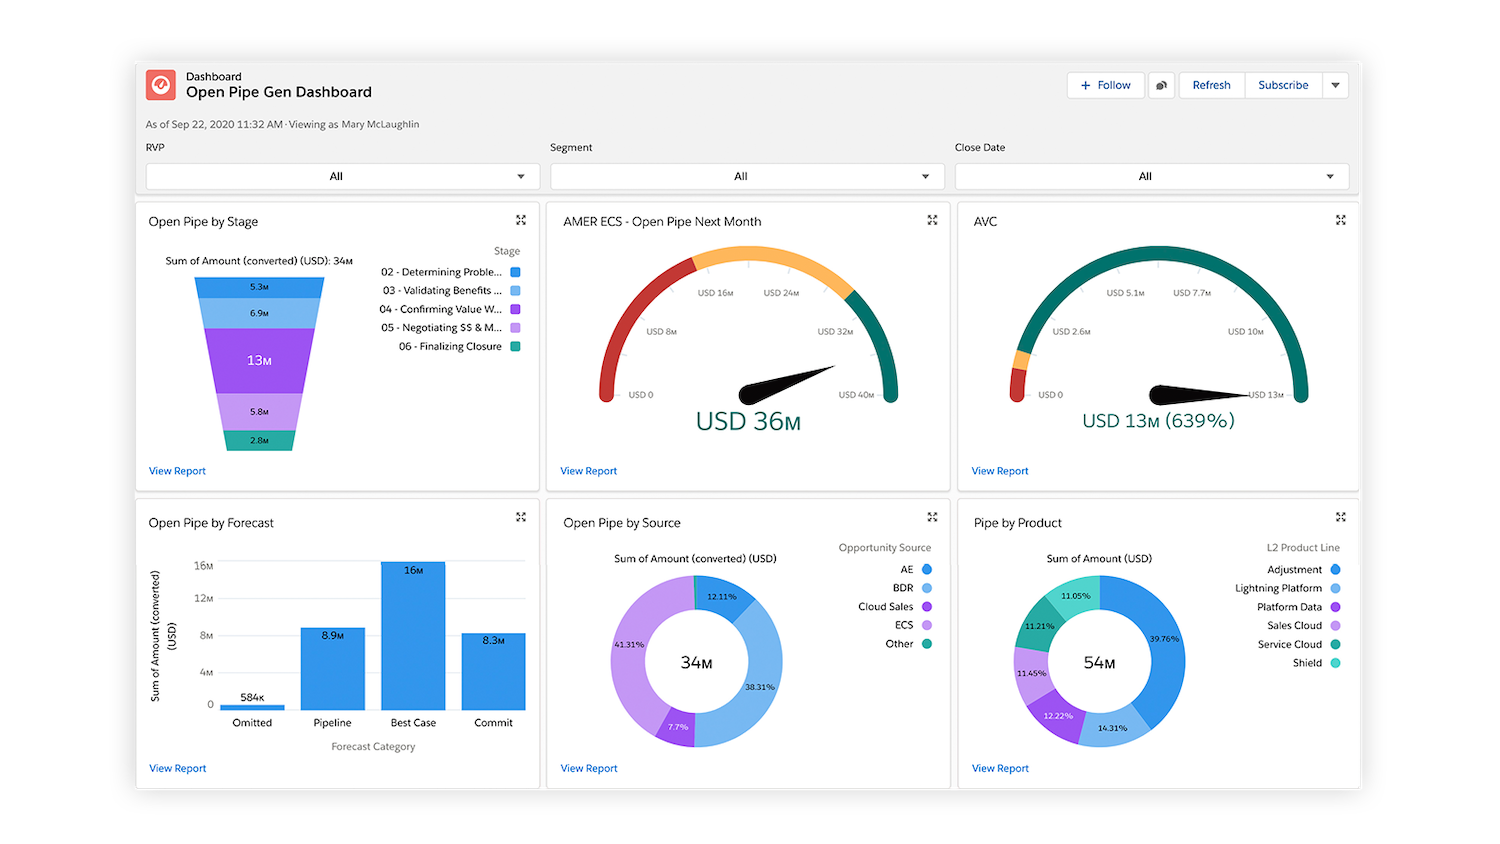
4. See if your pipeline is growing with ‘Open Pipe’
What this dashboard answers: What’s happening with my open pipeline?
Who it’s for: All sales
When to use it: Whenever you suspect a pipeline problem is impacting sales
How it works: Think of the Open Pipe dashboard as a pipeline X-ray. These sales management dashboards drill down into the quality of your pipeline at various stages. Do you have deals with no recent activity? Are your deals getting stuck in a certain stage? The Open Pipe dashboard will help uncover the culprit! At Salesforce, we warn against building a pipeline just for the sake of pipeline. Why? It’s not enough just to have one; you need to monitor the pipeline to make sure it’s expanding, too. This dashboard will help you get there.
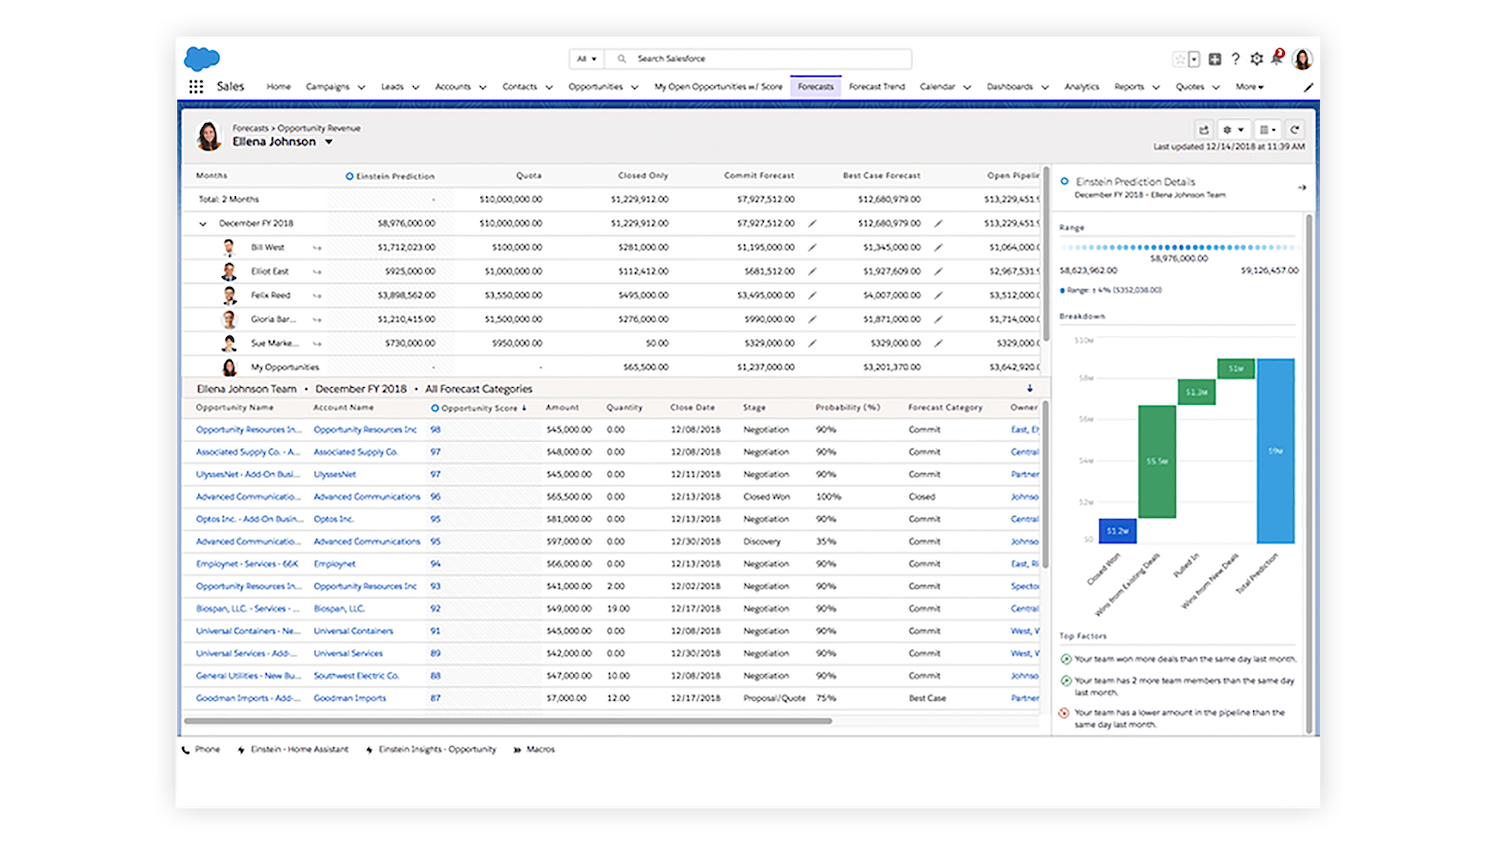
5. Stay on top of your projected revenue targets with ‘Forecast’
What this dashboard answers: What’s my forecast?
Who it’s for: Sales management, finance, executive team
When to use it: Weekly
How it works: Forecasts, which are expressions of predicted sales revenue, help sales teams plan their sales cycle and manage expectations across the company. Monitoring forecasts can help you uncover flaws early in the sales process and identify risk. Do you have enough pipeline to meet your goal? Does marketing need to come up with more leads? The forecast dashboard will give you visibility on all of these aspects. (This Trailhead learning module, Get Started on Collaborative Forecasts, is a great introduction to these sales management dashboards.)
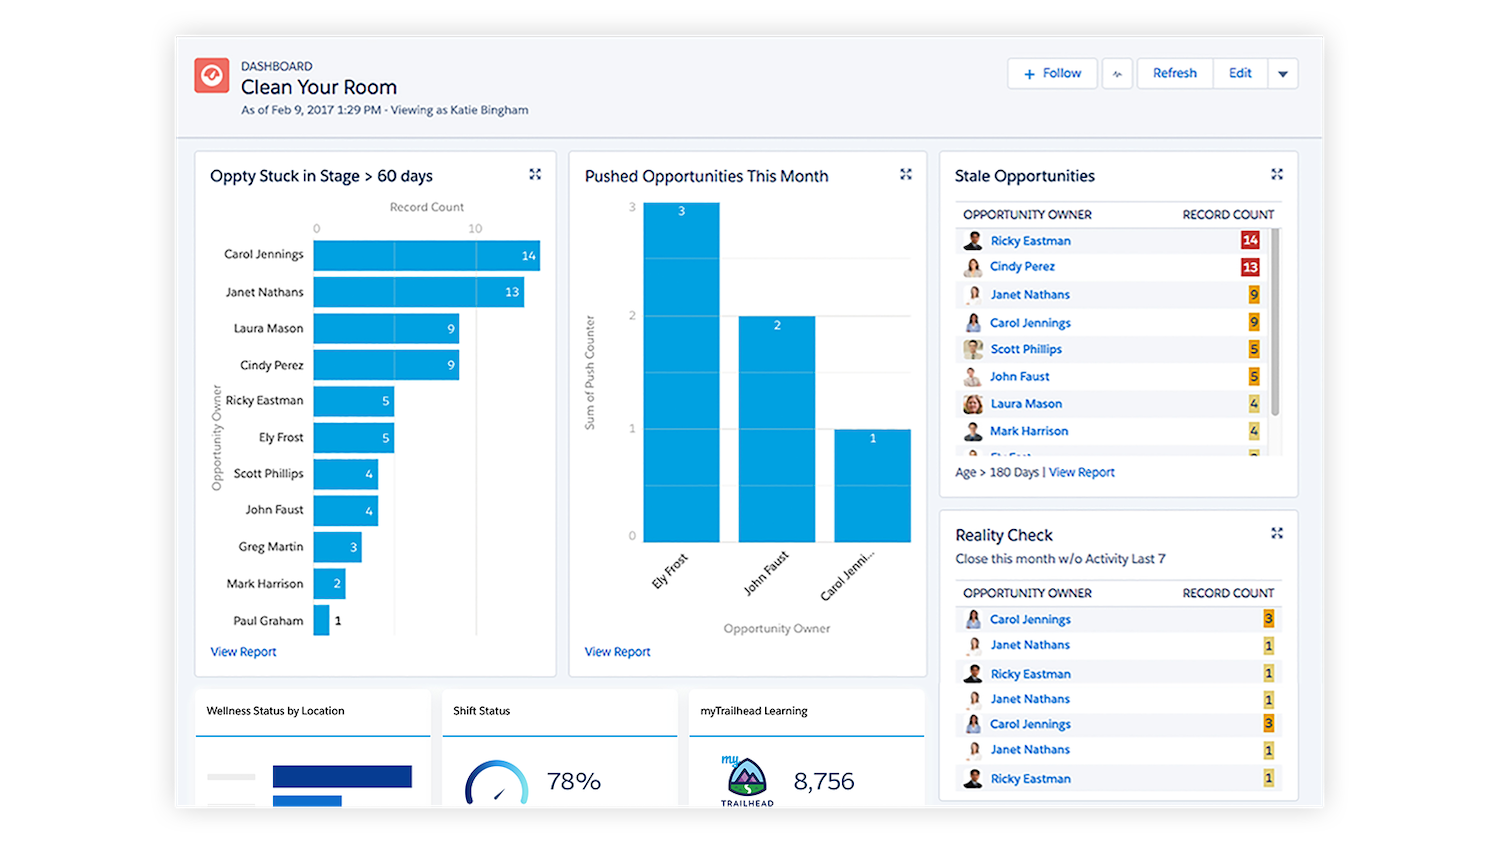
6. Make sure your reps are plugged into your CRM with ‘Clean Your Room’
What this dashboard answers: Are my reps making the most out of our sales tools?
Who it’s for: Sales reps
When to use it: Regularly
How it works: This dashboard is great for internal housekeeping. Sales managers can easily see which reps are keeping their deals current and accurate. If you don’t have clean data, your other dashboards like Open Pipe or Forecast metrics become less reliable. As the saying goes, “If it’s not in Salesforce, it doesn’t exist.” This dashboard drives your reps to use your CRM and promotes accountability, which is essential when everyone is remote. If a deal has remained open for too long or a rep is slow to follow up with a lead, Clean Your Room will reveal those gaps.
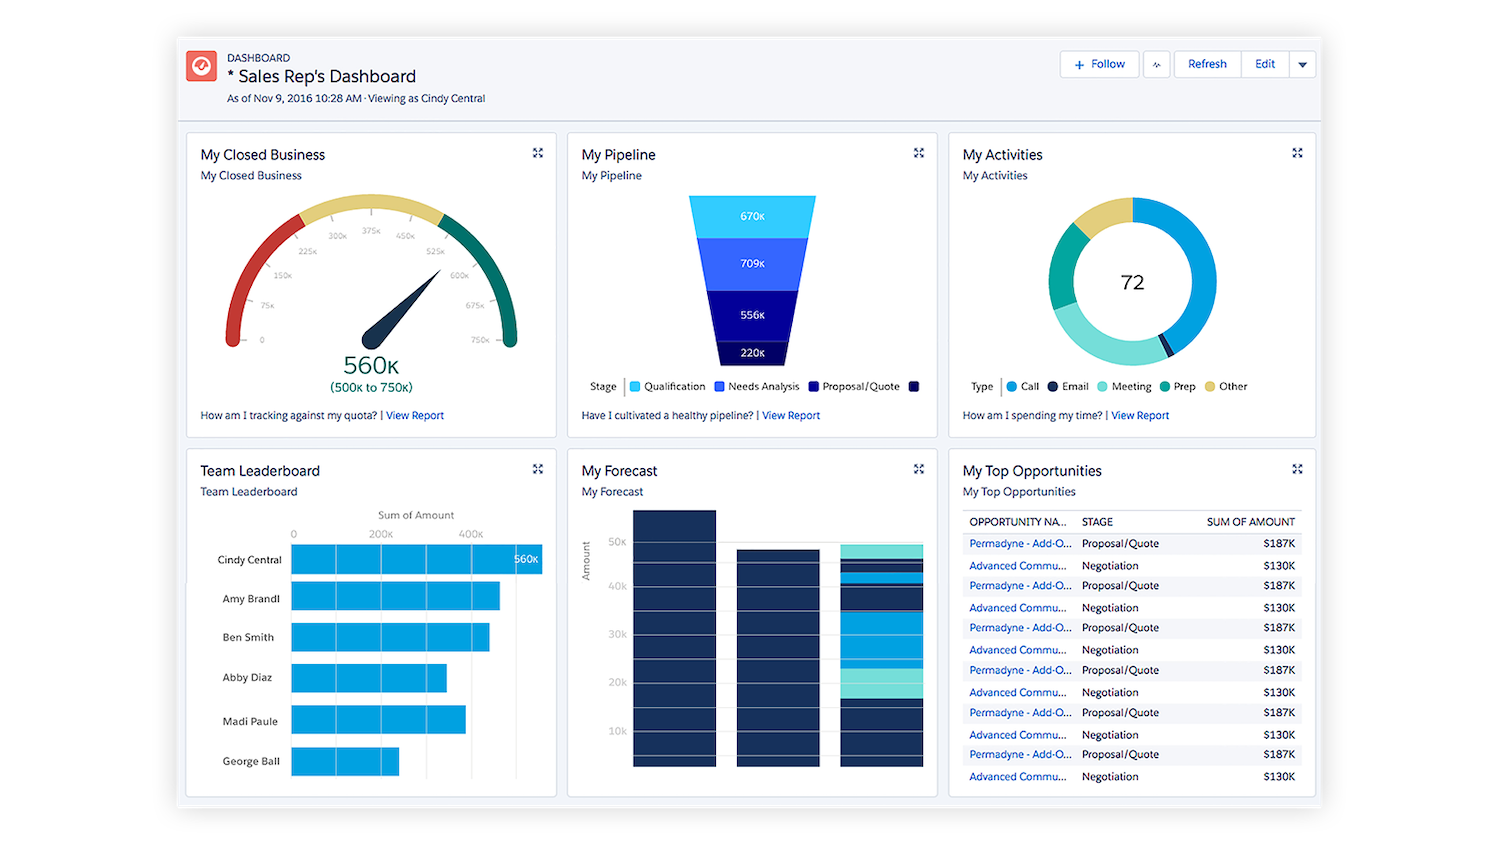
7. Don’t forget that ‘AE’ is basically an account executive report card
What this dashboard answers: How is my business doing?
Who it’s for: Account executives
When to use it: Daily
How it works: Account executives are the CEOs of their territory, meaning they need to understand their region inside and out. This dashboard is one of the most important weapons in any AE’s arsenal. It acts like a real-time report card, giving AEs an overview of how they’re performing and what goals they need to hit. It shows an AE’s top deals, top accounts, leads they may be overlooking, and progress toward their quota. Adopting the AE dashboard is an easy way to get AEs to live in their CRM and help keep them organized.
Use sales management dashboards effectively
Ultimately, sales management dashboards are a tool that provide perspective and expose weak points. But it’s up to you to wield it effectively. By taking advantage of these seven dashboards, sales leaders will have the insight needed to make informed decisions about their business.
Read the full State of Sales report, our research survey of reps, sales ops, and leadership on recovery and growth in this evolving selling landscape.
Discover timely insights and useful sales tips
Get the Sales in 60 Seconds newsletter for the latest and greatest sales content.


