

Most humans are visual learners. Our brains can process images much faster than we can read. Think about this: If you were given a piece of furniture to assemble, would you rather go through a lengthy verbal instruction manual or a simple diagram that shows where each part should go?
Now think about the amount of data we generate every day.In 2020 alone, 64.2 zettabytes of data were created worldwide. The benefits that can arise from being able to derive insights from all of this data are limitless.
By giving it visual context, data becomes easier to process, increasing its usability. Here’s where data visualisation tools can help.
Data visualisation involves presenting information in a graphical or pictorial form, allowing easy recognition of patterns. Through visualisation, you can make data more comprehensible and draw actionable insights from it.
Here are some of the top benefits of data visualisation for businesses that wish to build a data culture:
1. Need for speed
Data visualisation tools can process and collate more data in seconds than your average analyst can prep manually in months. By making it easier for your analysts to understand and consume data, you can put critical information to use before it goes obsolete.
Let’s say the demand for your product is rapidly declining in some parts of the country while other regions face shortages. By placing real-time data sets on a map, you can quickly devise a redistribution strategy to optimise sales.
2. Reading between the lines
Data visualisation can reveal interesting trends and patterns difficult to spot otherwise. You can gain exclusive insights by identifying previously unseen correlations and specific conditions that produce certain results.
For instance, plot how customer reactions and sentiments change based on different triggers on a graph. This can help you understand how to shape your brand perception over time.
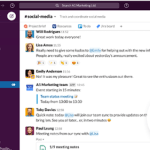
3. Sharing insights made easy
Create dashboards for each team member that put deep insights at their fingertips. Drive higher growth by unifying the entire organisation around a single source of truth and customise it for any user based on their roles and skill sets.
Case in point: your data analysts create extensive visualisations to compare the performance analysis of all your products for the leadership team, and only share simplified versions with the relevant teams without missing a beat.
4. No more book-sized reports
Does your company produce annual reports or similar data-heavy documents? You can instead use simple, beautiful visual formats to present most of this information dynamically. This can help you grab users’ attention and provide overviews easily.
5. Identifying and addressing gaps
Combine data with Artificial Intelligence (AI) to extract actionable insights that can help you bridge business gaps. By giving analysis visual form, you can also make it easier for non-specialised and business users to use this data and create greater impact.
How data visualisation is used can determine what it reveals and help you gain a competitive edge. Harness the power of data and visual imagery to enable faster, data-driven decision-making throughout your organisation.
Tableau is an easy-to-use and powerful visual analytics platform. It can help you find everyday opportunities as well as eureka moments with rich visual analytics, storytelling, and collaboration capabilities. It also has an in-built AI engine to improve results and provides insights right within your Salesforce CRM.
Want to know more about the benefits of visual analytics? Click here to see Tableau in action.