Since its founding, Tableau has become much more than a data tool. It is a story enhancer, career transformer, strategic adviser, and the foundation of an entire community.
Public education worker Bo McCready never saw himself as a numbers guy. With a Ph.D. in Educational Leadership and Policy and a history of avoiding math, the Wisconsin native looked at digits strictly when he needed to generate graphs at work using Tableau.
His data journey began with curiosity. Having recently been to a Tableau Conference, he decided to use his newly created account on Tableau Public, an online platform to create and share interactive visualizations of public data, to develop a visualization that looked at election results by county in his home state. Around the time of his 32nd birthday, he started wondering how common his birth date was and developed a visualization of popular birthdays. His deep dive into Social Security Administration data revealed some surprising trends, like how superstition might play a role in when people give birth, noting the 13th of each month had a lower birth rate than the 12th or 14th.
He learned others shared his curiosity when this visualization caught fire on Reddit, gaining 55,000 upvotes and the attention of popular media outlets such as Digg. As he continued “vizzing” – developing visualizations on Tableau Public for personal interest – many of his posts were featured at the top of Reddit, in educational materials, and in articles from publications like Forbes.
“Tableau Public has been a source of motivation and inspiration since I began using the platform,” McCready said. “If it weren’t for Tableau Public, I never would’ve realized where my passion lies within analytics.”
McCready is just one of more than 4 million Tableau users who have realized the effect visualizations can have on driving action from data, as well as the impact the tool can have on their careers.
Using Tableau Public as a professional portfolio
From looking at the number of words spoken in each episode of The Office, to tracking NFL draft picks, to processing grief by following the emotional data of his father’s three year battle with metastatic melanoma, Tableau transformed the way McCready approached storytelling and sparked a passion that was more than a hobby.
With a portfolio so robust, it’s no surprise that McCready became a stand out candidate for data analysis jobs despite an unconventional background. In 2020, he accepted an offer to work full time on data visualization at a popular tech company, where he still works today.
“Tableau Public offers all of us a chance to show what we can do through our actual work, rather than just a list of credentials and experiences,” McCready reflected. “In contrast to what I experienced in academia, it’s not about your history, your degrees, or your titles — it’s about who you are and what you create.”
It’s not about your history, your degrees, or your titles — it’s about who you are and what you create.
Bo McCready, Tableau User
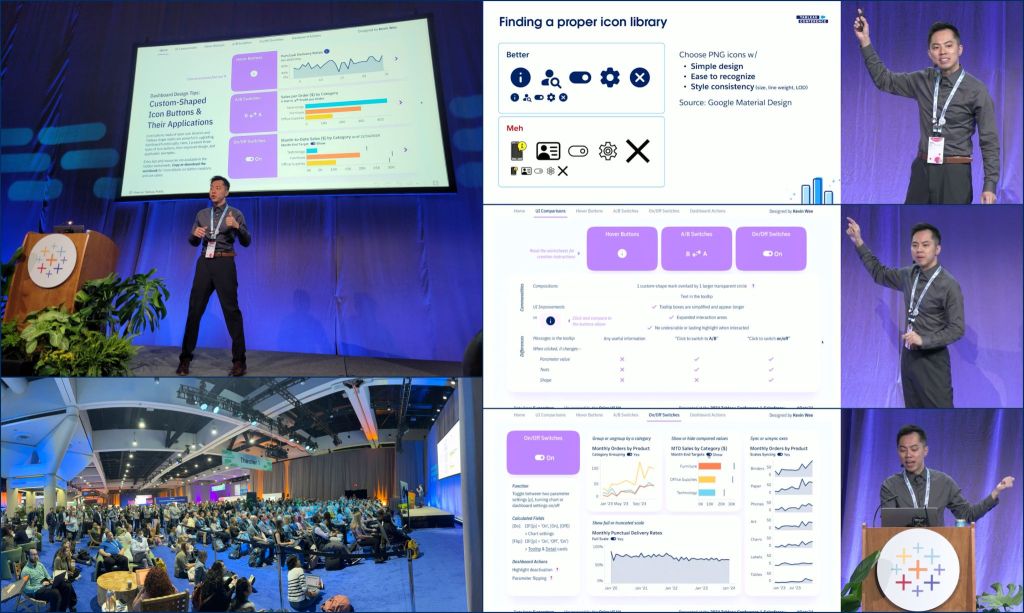
Kevin Wee, a Lead BI Analyst at Discover Financial Services had a similar experience when he received an offer for his current job because of visualization projects on his profile. Starting on Tableau Public in 2020, he built up his portfolio by having four vizzes chosen as “Viz of the Day”, being appointed as a community leader, and speaking at Tableau Conferences multiple times in just 5 years.
“Signing up for a Tableau Public account has been a turning point in my data career,” he shared. “The DataFam has been the most critical element in my Tableau journey. I owe it to my success in career change.”
Victor Muñoz used his background in Information Security analysis to bring a unique perspective to data visualization. Hoping to pivot career paths, two months into using Tableau Public he activated the “Hire Me” button on his profile to show that he was open to opportunities. Within weeks, he was offered a role to create data visualizations that showcased healthcare issue prioritization in different regions.
“While I initially focused on mastering Tableau, this project provided a better understanding of the administrative aspects, including data visualization briefs, contracts, pricing models, and payment procedures,” he recalled. “Additionally, I have leveraged Tableau Public to build global connections, collaborate on social impact initiatives, and exchange knowledge and inspiration with the Tableau community.”
The importance of data in storytelling
With Tableau, users can uncover, visualize, and present data as actionable insights. These “data stories” range from novel to business-critical and combine analytical and creative skills to result in more informed, strategic decisions.
“Gone are the days when companies were making decisions based on their gut,” said Elizabeth Maxson, SVP and Chief Marketing Officer at Tableau. “Data powers strategy, and with Tableau, organizations have the insights they need to back up the decisions they make.”
Founded in 2003, Tableau was formed with the goal of improving data accessibility, analysis, and visualization. Since then, ongoing research and development has simplified business intelligence and analytics tools, making the insights they produce accessible to all knowledge workers (not just data scientists).
“Early on, our mission was to help people see and understand data with a focus on the analytics user,” Maxson said. “Now, we help people see, understand, and take action based on their data. That action piece is critical, and it applies to every single person in a company no matter where they work.”
We help people see, understand, and take action based on their data. That action piece is critical, and it applies to every single person in a company no matter where they work.
Elizabeth Maxson, SVP and Chief Marketing Officer, Tableau
As time went on, Tableau added features and functionality that allowed people to inject a little creativity into how they viewed and used data. In 2010, the company introduced Tableau Public. The idea was to make data a first-class citizen on the web and empower Tableau users to share their creative insights with one another.
In her free time, Maxson enjoys discovering new visualizations on the platform and is inspired by the way data storytelling has been used for everything from entertainment (like the IMDb partnership that encouraged users to develop visualizations with a dataset of movies), to awareness of world issues (such as lack of diversity, gaps in representation, or rising labor costs).
Tableau also inspires organizations to adopt a data culture, meaning they should value and encourage the use of data to improve decision-making. As more and more Tableau users adopted this culture, a community began to form, and the ability to connect on Tableau Public gave them a place to grow. In fact, the number of profiles on the online platform continues to increase by 30% year-over-year. The Tableau Community — coined DataFam — connects everyday to share their visualizations on just about any topic.
The DataFam culture
The Tableau Community today is a group of data enthusiasts in the Salesforce ecosystem – and anyone can join. By signing up for Tableau Public, asking questions in forums, or joining a user group, Tableau users can up-level their data journey and connect with like-minded people who share a passion for data storytelling.
“Everyday I hear a new story about how our community has bettered someone’s life or advanced their career,” said Maxson. “I’m amazed when I go to user groups and come out having learned something new about our product, or attend Tableau Conference and see the community’s evangelism for our mission.”
I’m amazed when I go to user groups and come out having learned something new about our product, or attend Tableau Conference and see the community’s evangelism for our mission.
Elizabeth Maxson, SVP and Chief Marketing Officer, Tableau
Passionate and involved community members can even work up the ranks to become Community Leaders. Leaders – Ambassadors and Visionaries – are appointed by peers as individuals that embody the best of the community. These ranks are reached by sharing expertise, creating exceptional data visualizations on Tableau Public, building a data culture in organizations, and nurturing relationships within the DataFam.
Veronica Simoes is an early member who has seen the community expand since 2011. She is the co-founder and CEO of PATH, a Brazil-based agency that helps companies implement a data culture and supports the Tableau Brazil customer base through training and tip sharing. As an Ambassador and Visionary, she is active on community forums, answering questions and providing expertise.
Community leaders are well known as subject matter experts and valued voices to Tableau leaders. Maxson herself will often ask Visionaries for feedback on upcoming products or event keynotes to get their unique and important perspective. In 2023 alone, Tableau leveraged more than 30 ideas from the Tableau Community across 20 features.
“The community is involved in everything we do, from influencing features in our product to how we message to the market. Their input is invaluable.”
Tableau in an AI world
Tableau products continue to evolve with the priorities of its users. Every company is looking to implement AI, but as any DataFam member will tell you, a successful AI strategy has to start with a successful data strategy. As Maxson described it, organizations are in an “infinite loop” where data powers AI, which then powers data.
Tableau Pulse was introduced in 2023 to deliver personalized and contextualized insights and natural language Q&A to users to help them make faster decisions right in the flow of work. It has become one of Tableau’s fastest growing products of all time. And earlier this year, Tableau introduced Pulse for Salesforce, which brings these AI-powered insights from Tableau Pulse directly into Salesforce CRM.
“Years ago our customers would rely on a team of analysts to get reports and insights, and by the time they got it, data would often be out of date,” said Maxson. “ Tableau Pulse has lowered that barrier, meeting customers where they are in the flow of work with the data they need at that moment to make better and faster decisions.”
In a continued commitment to reimagine the business intelligence and analytics experience, the company announced Tableau Einstein at Dreamforce 2024, infusing autonomous and assistive agents into every aspect of analytics to help everyone answer, engage, and act on insights directly from where they work in real time.
Eighty-one percent of IT leaders say data silos hinder digital transformation, and 94% of business leaders believe they should be getting more value from their data. Additionally, only 30% of employees across the average enterprise report they are currently using data to make decisions. Tableau Einstein can make using and taking action on data efficient by surfacing contextual data and insights in the flow of work — including Salesforce and third-party apps.
Tableau expects to scale to new heights as humans and agents drive customer success, together. And if the last 11 years are any indication, the Tableau Community will be at the forefront, ready to dive into the innovations to come.
Learn more:
- Join a Tableau user group to begin your data journey or dive deeper on your favorite topics
- Create a Tableau Public profile
- Submit and share visualizations using IMDb datasets
- Intelligently embed data and insights across the flow of work and use data to drive action with Tableau Einstein


