Choose Another Solution
-
See your business in one view.
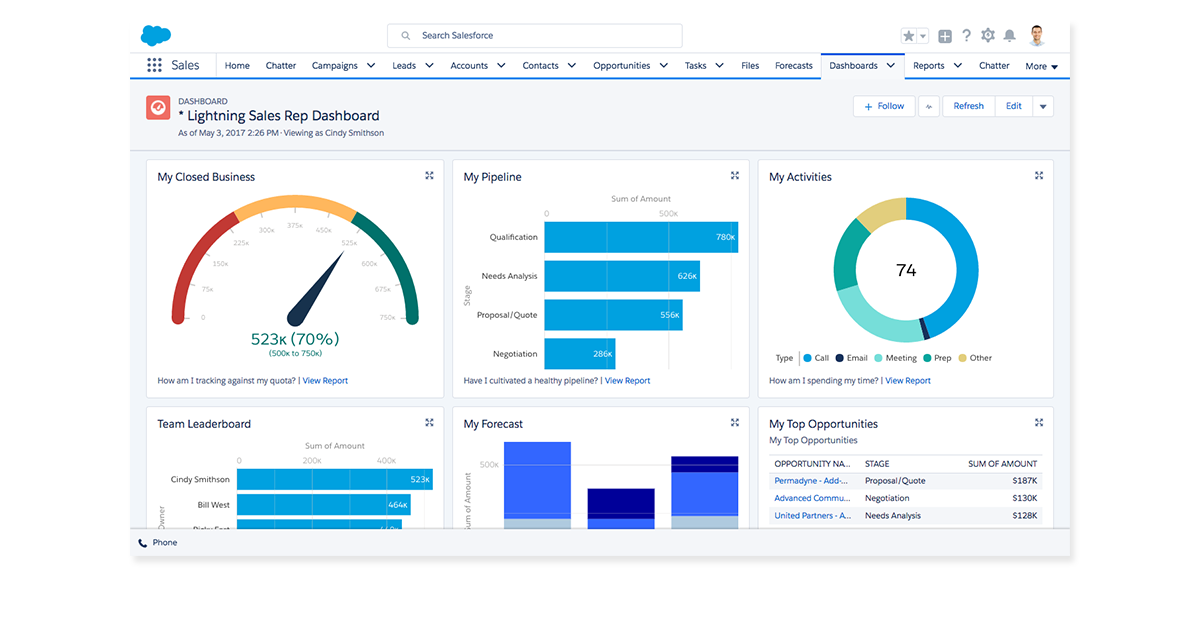
1. See your business in one view.
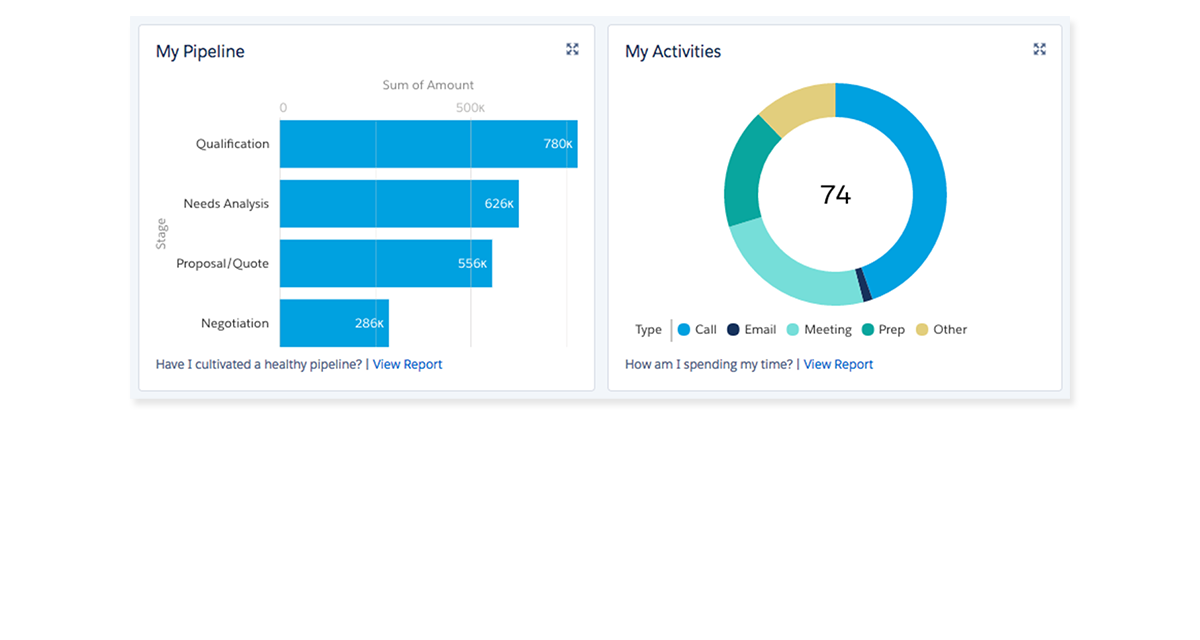
Sales Cloud comes with powerful, built-in and customizable dashboards for all your business needs that make it easy to see how your business is running at a glance.
-
View your entire pipeline.
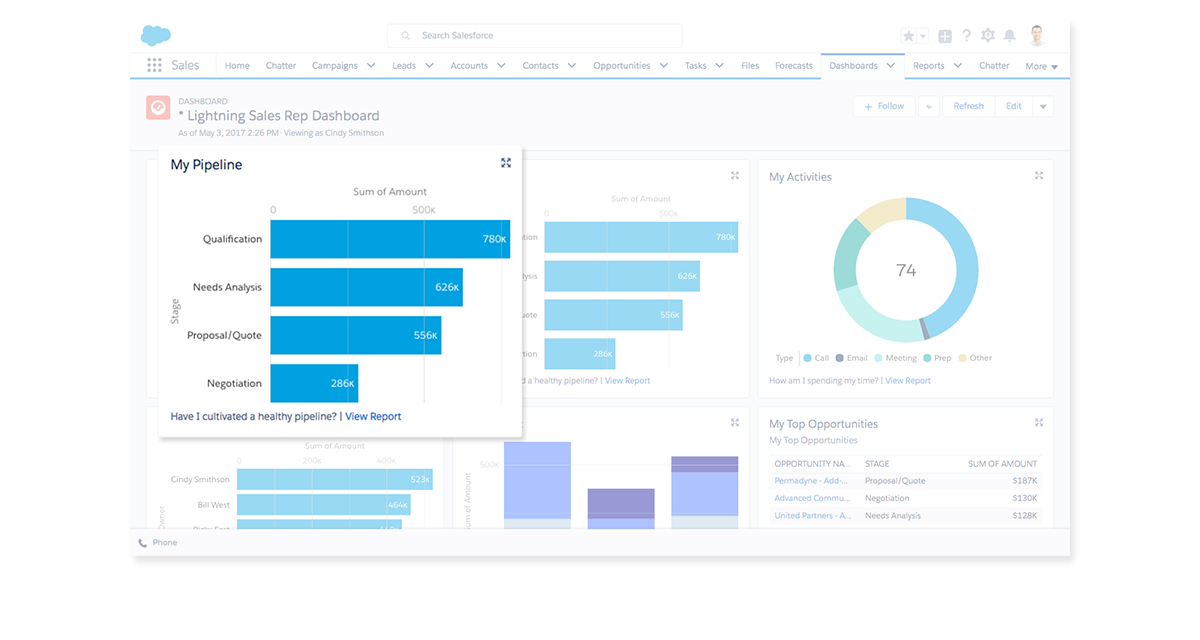
2. View your entire pipeline.
This dashboard component displays the total pipeline for your business broken out by stage.
-
Customize your dashboard.
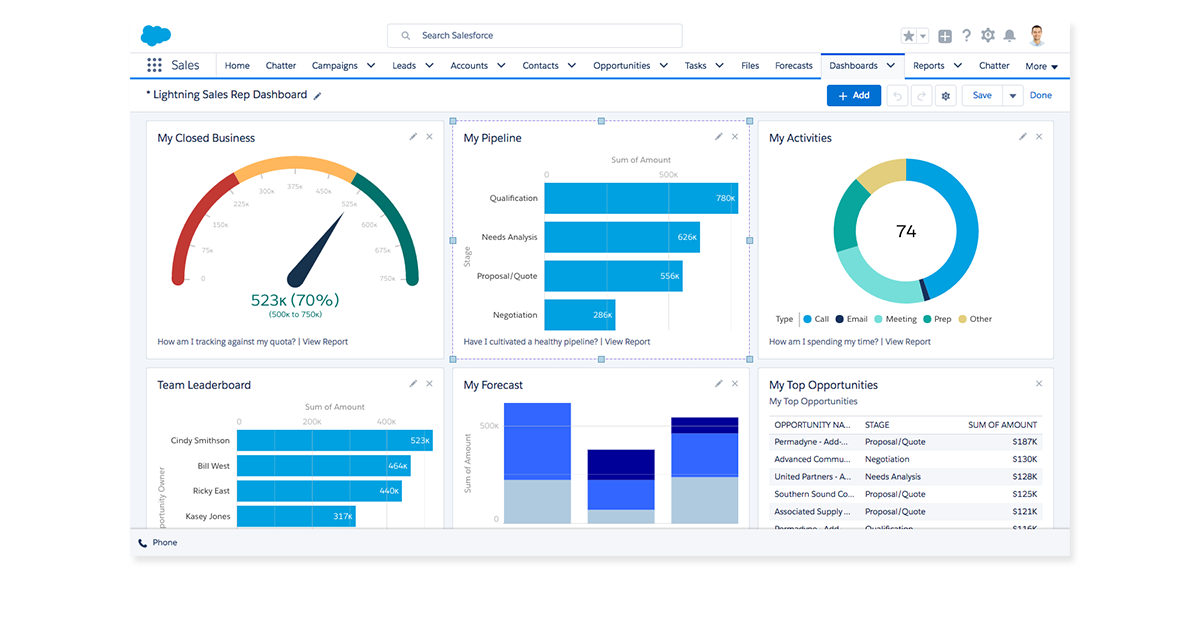
3. Customize your dashboard.
Sell exactly how you want by rearranging components, or even quickly making your own. For example, bring in a new pie chart to help you track pipeline by stage.
-
Salesforce1 Mobile App
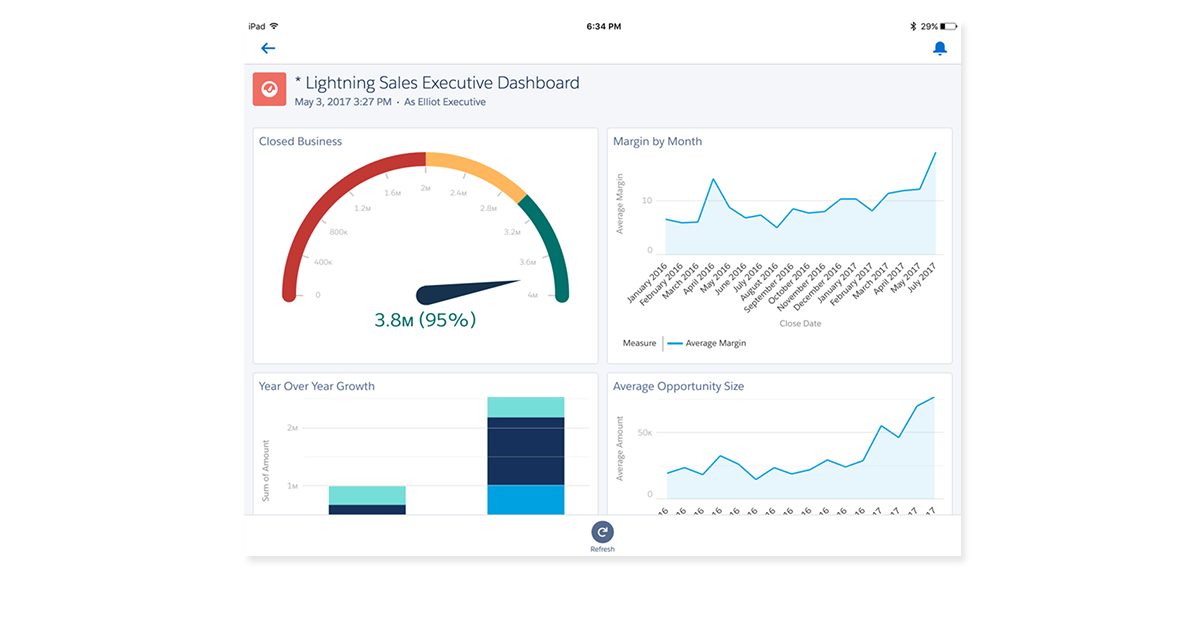
4. Salesforce1 Mobile App
Thanks to the Salesforce1 Mobile App, all of your dashboards — custom or otherwise — are available with real-time data wherever you are.
-
Go deeper to find insights.
5. Go deeper to find insights.
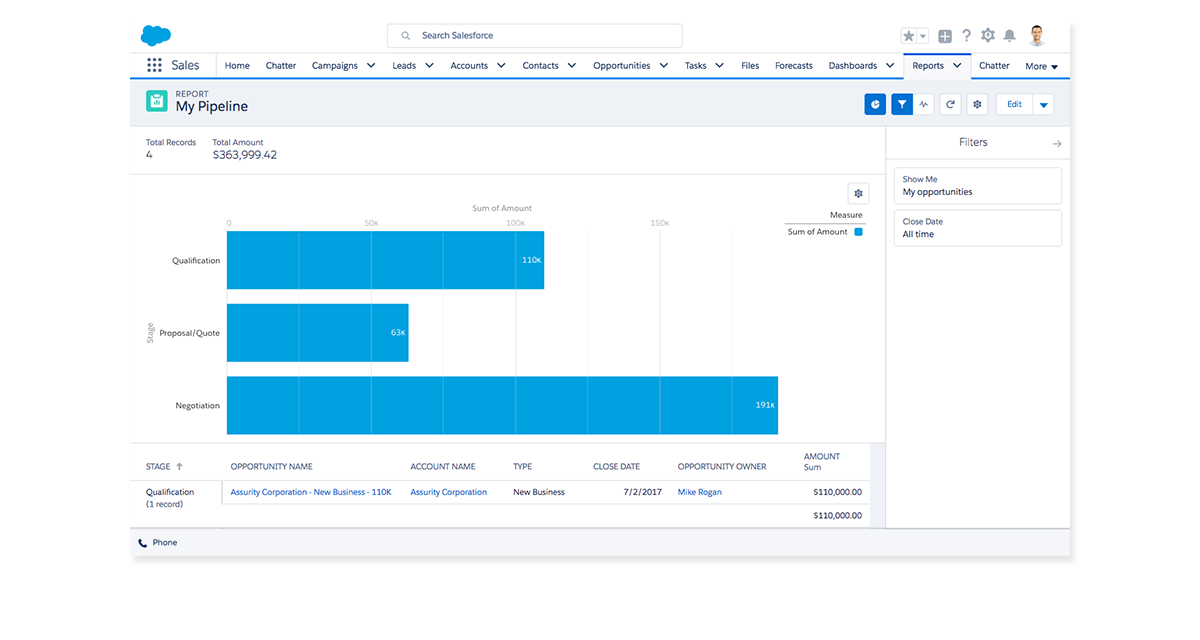
When you want to know the story behind what your dashboards are telling you, it’s a single click to get a detailed report that provides you with an incredible amount of information about your business. You can filter and sort data in many ways to help you quickly answer your questions.
-
Filter your reports.
6. Filter your reports.
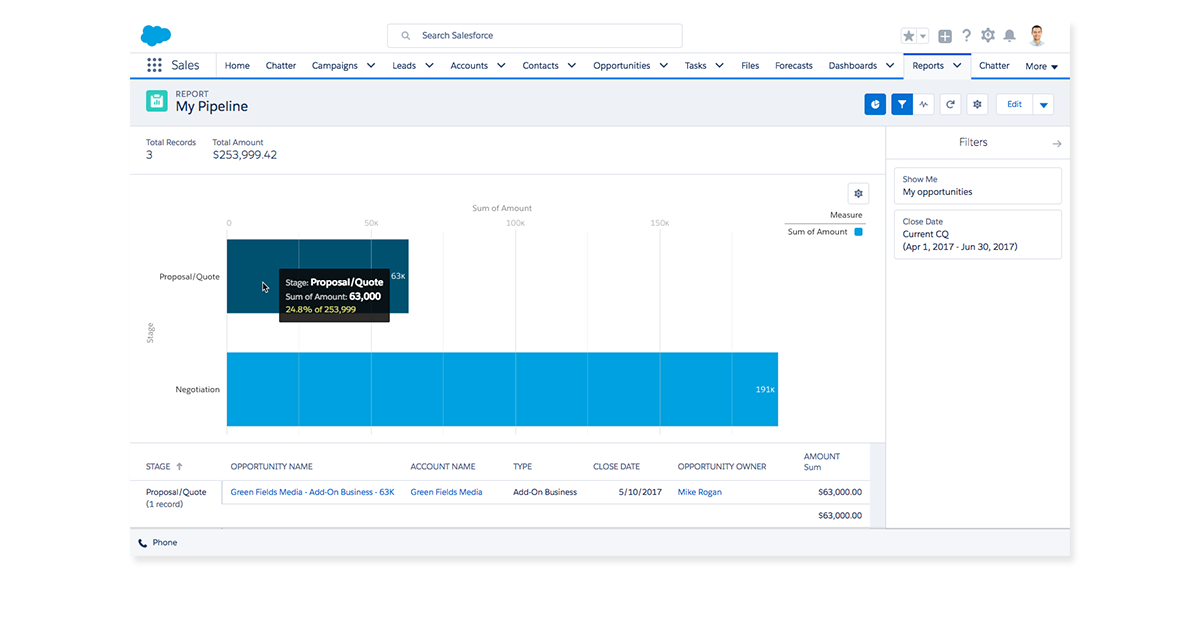
Filtering reports is easy and incredibly powerful. For example, here we can filter all the opportunities in our pipeline by a specific time frame. Let’s see what’s closing this quarter.
-
Find action points.
7. Find action points.
Now that we’ve filtered this report, it’s easy to see the deals that are closing soon. Discover what you need to get done to get across the finish line.
-
Take the right action.
8. Take the right action.
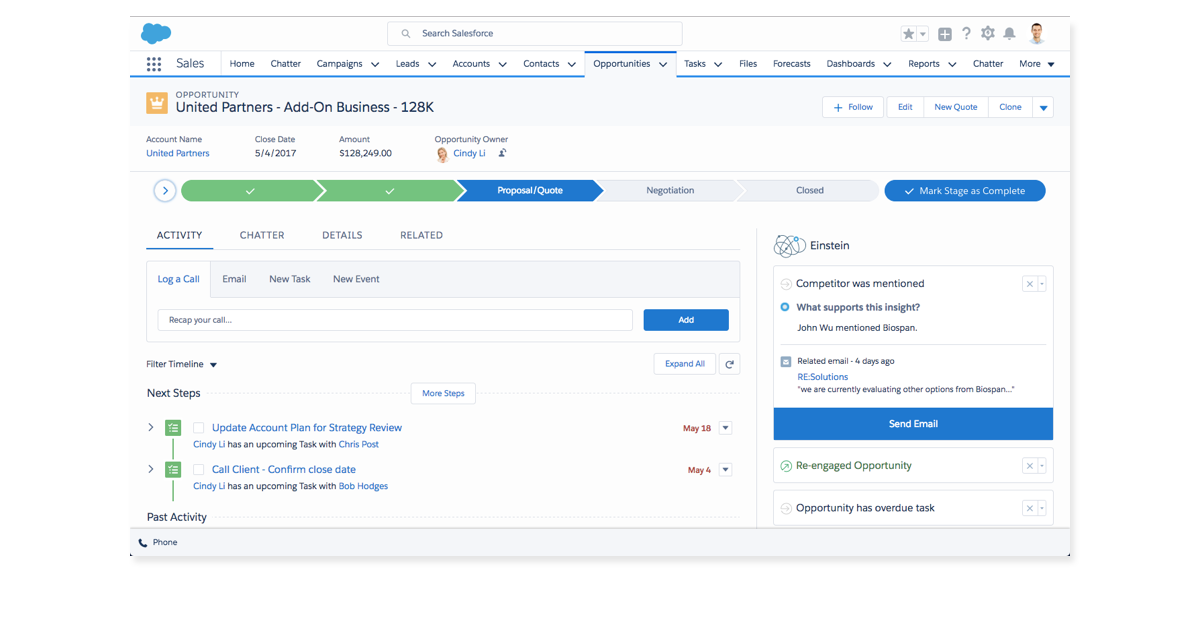
With just a click, we now see the entire history and context of this deal, and can take action to move it forward.
Finish

